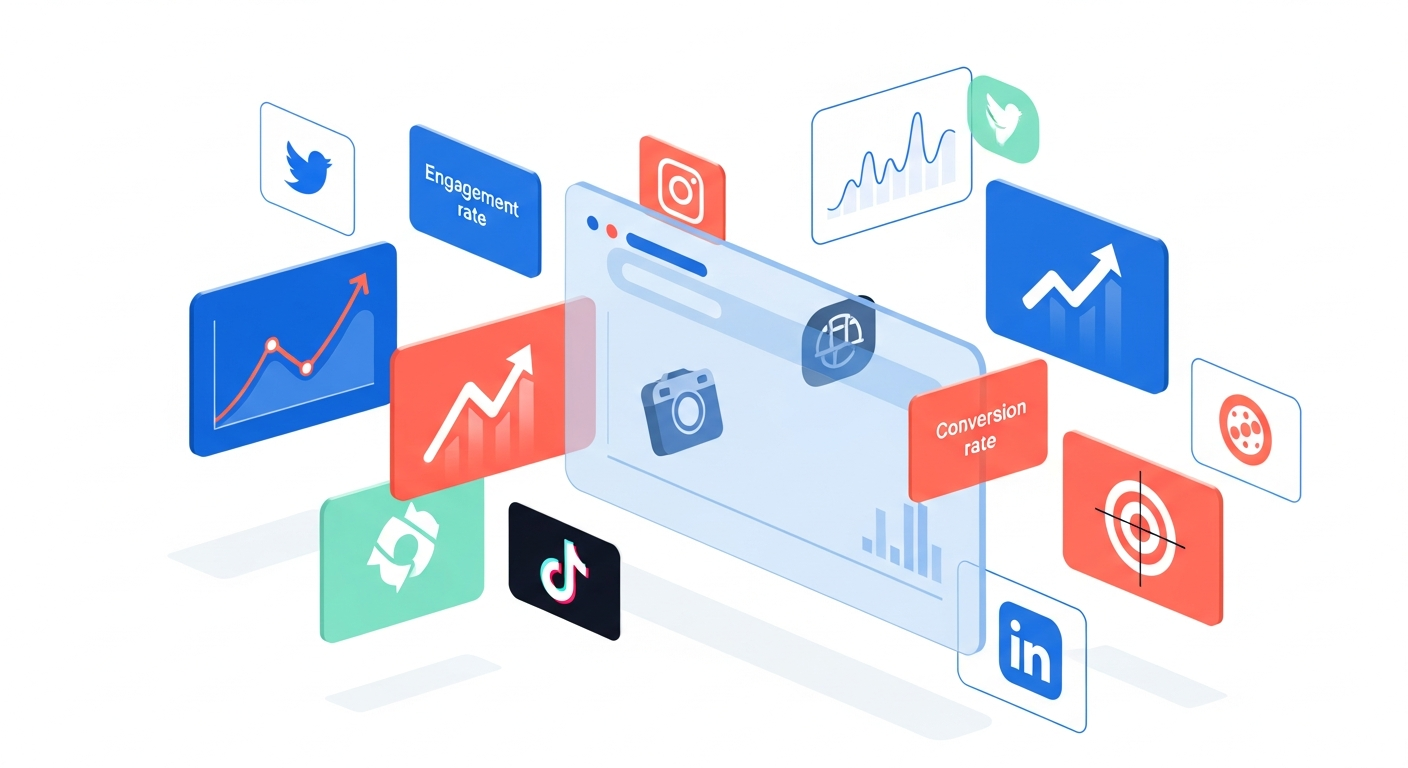
15 Social Media KPIs You Should Be Tracking in 2026
The days of measuring social media success by follower counts alone are long gone. In 2026, the brands winning on social aren't just posting content—they're building intelligence systems that connect every metric to business outcomes. Yet most marketing teams still track vanity metrics that tell them nothing about what's actually working.
Introduction
Here's the uncomfortable truth: you're probably tracking too many metrics and understanding too few. The average social media dashboard displays 20+ data points, but research shows that only 4-6 KPIs actually correlate with revenue growth for most businesses.
This guide cuts through the noise. We'll cover the 15 social media KPIs that matter most in 2026, organized by what they actually measure: awareness, engagement, conversion, and competitive position. More importantly, we'll show you how to track them effectively and what benchmarks to aim for.
Awareness KPIs: Measuring Your Reach
Before anyone can engage with your brand, they need to see you. These KPIs measure how far your content travels and how many people encounter your brand.
1. Impression Count
Impressions tell you how many times your content was displayed, regardless of whether someone engaged with it. This remains foundational because you can't optimize what you can't see.
2026 Benchmark: Healthy accounts see 3-5x more impressions than their follower count per month.
What to watch: A declining impression-to-follower ratio often signals algorithm deprioritization—usually from low engagement or content quality issues.
2. Reach vs. Impressions Ratio
Reach counts unique viewers, while impressions count total views. The ratio between them reveals whether you're reaching new audiences or showing content repeatedly to the same people.
2026 Benchmark: A reach-to-impression ratio above 0.7 indicates healthy audience expansion. Below 0.5 suggests content is circulating within your existing audience.
3. Share of Voice
Share of voice measures your brand's visibility compared to competitors within your industry conversation. This contextualizes your metrics against the competitive landscape.
How to calculate: (Your brand mentions ÷ Total industry mentions) × 100
2026 Benchmark: Category leaders typically command 25-40% share of voice. Challenger brands should aim for consistent growth of 2-3% quarterly.
Engagement KPIs: Measuring Connection Quality
High impressions mean nothing if people scroll past without stopping. Engagement KPIs reveal whether your content resonates.
4. Engagement Rate by Reach
This measures the percentage of people who saw your content and took action (liked, commented, shared, saved). It's more accurate than engagement rate by followers because it accounts for algorithmic reach variations.
Formula: (Total engagements ÷ Reach) × 100
2026 Benchmarks by Platform:
- Instagram: 3-6% (excellent above 6%)
- Twitter/X: 0.5-1% (excellent above 2%)
- LinkedIn: 2-4% (excellent above 5%)
- TikTok: 4-8% (excellent above 10%)
5. Comment-to-Like Ratio
Comments require more effort than likes, so this ratio indicates content that sparks genuine conversation versus passive acknowledgment.
2026 Benchmark: A ratio above 1:10 (one comment per ten likes) indicates high-quality engagement. Ratios below 1:50 suggest content that's likeable but not discussion-worthy.
6. Save and Share Rate
Saves and shares represent the highest-value engagement actions. A save means someone wants to return to your content; a share means they're willing to attach their reputation to it.
2026 Benchmark: Combined save-and-share rate above 2% of impressions indicates content with lasting value.
7. Amplification Rate
This measures how often your content gets reshared relative to your follower count. High amplification means your audience actively expands your reach.
Formula: (Shares ÷ Followers) × 100
2026 Benchmark: Above 1% is healthy; above 3% indicates viral potential.
Try this with Xpoz
No API keys needed. Query Twitter, Reddit, Instagram & TikTok with natural language.
Conversion KPIs: Measuring Business Impact
Engagement feels good, but does it drive results? These KPIs connect social activity to business outcomes.
8. Click-Through Rate (CTR)
CTR measures the percentage of people who click your links after seeing your content. It bridges the gap between social engagement and website traffic.
2026 Benchmarks:
- Organic posts: 1-3%
- Paid social: 0.5-1.5%
- Stories with swipe-up/link stickers: 1-2%
9. Conversion Rate from Social
Of the people who click through from social media, what percentage complete a desired action (purchase, sign-up, download)?
2026 Benchmark: 2-5% for e-commerce; 5-15% for lead generation offers.
10. Cost Per Engagement (CPE)
For paid campaigns, CPE tells you how efficiently your ad spend generates engagement.
Formula: Total ad spend ÷ Total engagements
2026 Benchmark: Varies widely by industry, but CPE should decrease as campaigns optimize. A 20-30% CPE reduction over a campaign's lifetime indicates healthy optimization.
11. Social Attribution Revenue
The ultimate KPI: how much revenue can you trace back to social media touchpoints? This requires proper attribution modeling but provides the clearest picture of social ROI.
2026 Reality: Most brands undercount social attribution by 30-50% due to tracking limitations. First-touch and last-touch models capture only part of social's influence on the buyer journey.
Competitive Intelligence KPIs: Measuring Market Position
Your metrics mean more in context. These KPIs benchmark your performance against competitors and industry standards.
12. Competitor Engagement Benchmark
Track not just your engagement rates but how they compare to competitors in your space. An engagement rate of 3% might be excellent in B2B software but mediocre in fashion.
How to track: Monitor engagement rates across 3-5 direct competitors monthly. Plot trends over time to identify who's gaining or losing momentum.
13. Audience Growth Rate vs. Competitors
Raw follower counts matter less than growth velocity. A competitor with fewer followers but faster growth may overtake you within months.
Formula: (New followers ÷ Total followers) × 100, measured monthly
2026 Benchmark: Industry-average organic growth rates hover around 1-2% monthly. Sustained growth above 5% monthly indicates exceptional momentum.
14. Content Performance Gap
Identify which content types and topics perform better for competitors than for you—and vice versa. This reveals strategic opportunities.
What to track: Topic categories, content formats, posting times, and hashtag strategies that correlate with above-average performance in your competitive set.
15. Response Time and Rate
How quickly and consistently you respond to comments and messages directly impacts perceived brand quality and algorithmic favor.
2026 Benchmarks:
- Excellent: < 1 hour average response time, 95%+ response rate
- Good: < 4 hours, 80%+ response rate
- Needs improvement: > 24 hours or < 50% response rate
How Xpoz Enables Deep KPI Intelligence
Tracking these 15 KPIs manually across platforms creates a data management nightmare. Traditional analytics tools show you your own metrics but leave you blind to competitive context—the very benchmarks that make your numbers meaningful.
Xpoz transforms social media KPI tracking by combining your performance data with competitive intelligence at scale:
Engagement Analysis Across the Competitive Landscape. Using tools like getTwitterPostsByKeywords and getInstagramPostsByKeywords, Xpoz lets you monitor engagement patterns across entire market conversations. Instead of guessing whether your 4% engagement rate is good, you can measure it against every competitor and industry peer discussing relevant topics.
Real Amplification Intelligence. Track who shares your content and your competitors' content using getTwitterPostRetweets and getTwitterPostQuotes. Identify the high-influence accounts driving amplification and understand what content formats and topics generate the most shares in your space.
Audience Quality Metrics. Xpoz provides authenticity scoring and audience analysis through fields like isInauthentic, isInauthenticProbScore, and comprehensive follower analysis via getTwitterUserConnections. This helps you distinguish genuine engagement from bot activity—a growing concern as inauthentic engagement continues to inflate vanity metrics.
Volume and Trend Analysis. The countTweets tool enables precise volume tracking of keywords over time, essential for share of voice calculations and trend detection. Track mention volumes daily, weekly, or monthly to identify momentum shifts before they appear in standard dashboards.
Comment and Sentiment Deep Dives. With getTwitterPostComments and getInstagramCommentsByPostId, you can analyze the qualitative dimension of engagement—what people actually say, not just that they commented.
Practical Examples: KPIs in Action
Example 1: Diagnosing an Engagement Decline
A SaaS company notices their Twitter engagement rate dropped from 2.1% to 1.4% over three months. Using Xpoz, they:
- Pull competitor engagement data using keyword searches for industry terms
- Discover the industry average also dropped (algorithm change, not their problem)
- Identify two competitors maintaining higher rates
- Analyze those competitors' content using
getTwitterPostsByAuthor - Find that video content and thread formats resisted the engagement decline
- Shift content strategy accordingly
Example 2: Validating Influencer Partnerships
Before partnering with an influencer showing 500K followers and 8% engagement, a brand uses Xpoz to:
- Pull the influencer's follower list with
getInstagramUserConnections - Analyze follower authenticity and geographic distribution
- Check engagement patterns on recent posts using
getInstagramPostInteractingUsers - Discover 40% of engagements come from accounts with suspiciously similar creation dates
- Avoid a partnership that would have wasted budget on fake engagement
Example 3: Competitive Share of Voice Tracking
A fintech startup wants to measure their share of voice against three established competitors:
- Use
countTweetsto measure monthly mention volumes for each brand - Track the same metrics for key product categories
- Identify that while overall share of voice is 12%, they command 34% of conversations about a specific feature
- Double down on that positioning in content strategy
Key Takeaways
-
Focus on 4-6 KPIs maximum. Track 15 KPIs to understand your full picture, but optimize for the 4-6 that most directly connect to your business goals.
-
Context transforms data into intelligence. A metric without a benchmark is just a number. Every KPI should be measured against competitor performance, industry averages, and your own historical trends.
-
Engagement quality matters more than quantity. Comments, saves, and shares indicate genuine connection. A post with 50 thoughtful comments outperforms one with 500 hollow likes.
-
Authenticity verification is now essential. Bot activity and fake engagement distort every metric. Building authenticity checks into your measurement process prevents optimizing for vanity.
-
Attribution remains imperfect—account for it. Social media influences purchases in ways that current tracking often misses. Assume your social attribution numbers undercount true impact by 30-50%.
Conclusion
The social media metrics landscape will continue evolving, but the fundamentals remain constant: measure what matters, benchmark against reality, and connect metrics to business outcomes.
Start by auditing your current dashboard. Which of these 15 KPIs are you tracking? Which are you tracking well, with proper competitive context? Identify your biggest measurement gaps and address them systematically.
For teams ready to move beyond basic native analytics, tools like Xpoz provide the competitive intelligence layer that transforms raw numbers into strategic insights. Because in 2026, the brands winning on social aren't just measuring their performance—they're measuring the entire competitive landscape and finding opportunities others miss.